Matplotlib
Matplotlib is a comprehensive library for creating static, animated, and interactive visualizations in Python.

Matplotlib
Plotting Histograms with Matplotlib
Histograms are an important statistical analysis tool and can be quickly and easily generated using the Matplotlib hist function.
10 August 2022
Matplotlib
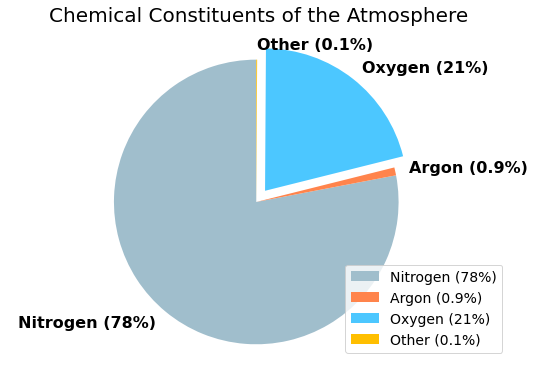
Creating Pie Charts in Matplotlib
A well designed pie chart can quickly and effectively convey important conclusions from a data set. We'll show you how to build great pie charts in Matplotlib.
09 August 2022

Matplotlib
How to Create Bar Charts Using Matplotlib
Learn how to create fully customizable vertical and horizontal bar charts using Matplotlib.
05 August 2022
Matplotlib
Scatter Plots in Matplotlib
Learn how to use Matplotlib's scatter function to identify relationships between two variables.
25 July 2022
Matplotlib
A Comprehensive Introduction to Matplotlib
Plotting and visualizing data is a key component of most Python projects. This guide has been written to assist you in getting up to speed with Python's plotting module, Matplotlib
21 July 2022
Still looking? Try one of the categories below.