Data Analytics and Automation Experts
Canard Analytics is an independent software consulting firm that equips companies with the tools and insights necessary to thrive in the digital economy. We believe that well-structured and carefully considered software provides an incredible lever with which to effect change.
Our work generally falls into one of three categories: data analytics, workflow automation and web-based services. Often these lines are blurred, and the final solution we provide usually consists of elements of all three. We complete the majority of our larger projects in Python, but also do many projects in Excel and VBA.
With a strong foundation rooted in mechanical and aeronautical engineering principles, we believe we are perfectly positioned to partner with you to grow your business through data-centric decision making and automation.
Canard Analytics was founded by aeronautical engineer Andrew Wood in 2022. You can read more about our founding story, and you're encouraged to take a look at the company's guiding principles which informs everything we do.
Consulting Services
We offer general consulting services in the following broad areas.
Workflow Automation
We'll work with you to evaluate your existing processes to identify bottlenecks and inefficiencies, before getting to work on a robust digital solution.
Our Automation Process Contact Us
Web Services
Canard Analytics provides a complete set of website and web application design and hosting services, from simple static sites, to complex web based applications.
Web Services Contact Us
Data Analytics
The world is awash in data but most of it goes unrefined and unused. We can partner with you to turn your data into insights, and your insights into action.
Our Analytics Process Contact Us
Productized Services
In additional to general software consulting we offer a number of productized services.
Word Clouds
Transform your words into powerful visuals that unlock insight, inspire, and resonate with your audience.
Learn More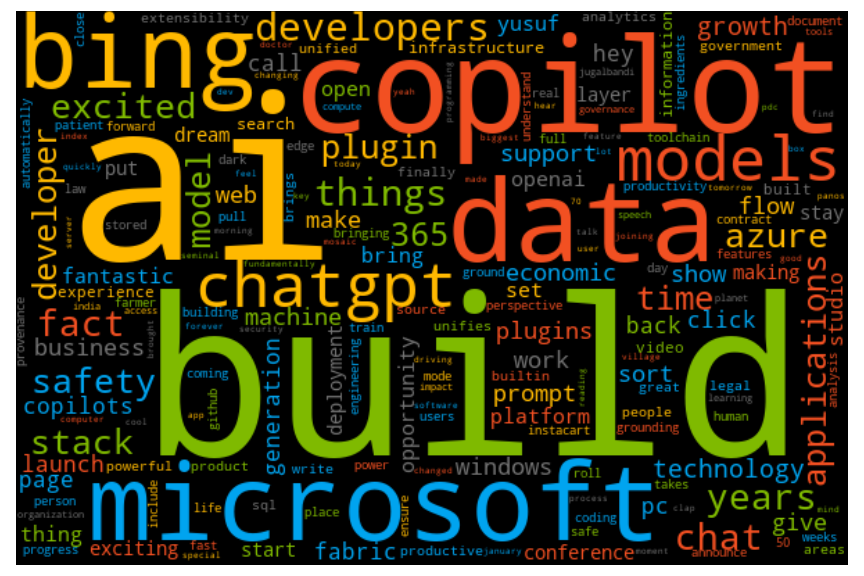
Web Scraping
Unlock a treasure trove of market insights, track your competitors, and drive growth with our web scraping services.
Learn More
Automated Reporting
Personalized insight and reporting designed to elevate your business intelligence powered by seamless API access.
Learn More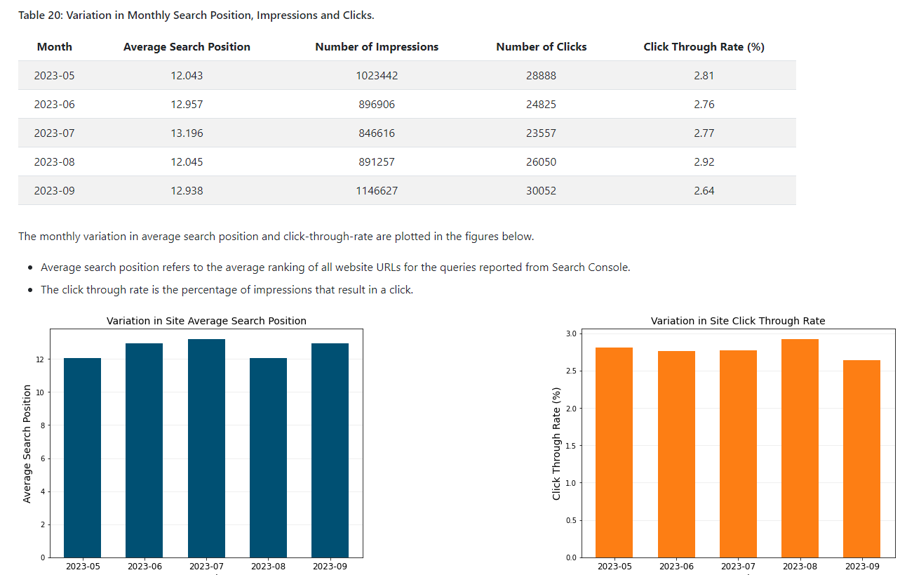
Our Knowledge Hub is filled with free high-quality Python tutorials.
Word Clouds
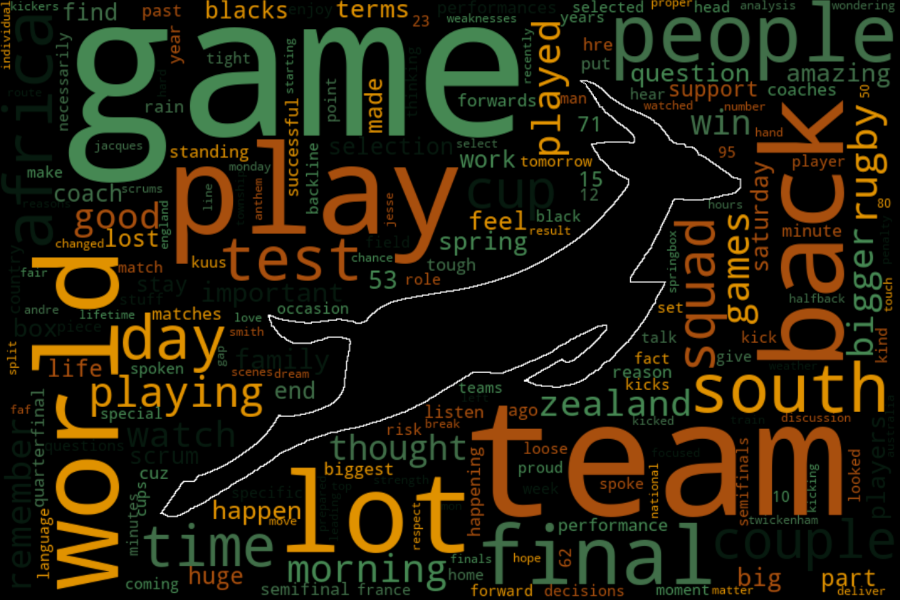
Word Cloud: Springbok World Cup Press Conference
Word Clouds
The Techno-Optimist Manifesto: A Word Cloud
Analytics
,
Automated Reporting
Grow your Business through Automated Analysis and Reporting
Word Clouds
Word Clouds as a Visualization Tool
Pandas
Pandas Groupby and Pivot Tables
Our Favorite Languages and Frameworks
