Nearly 250 years ago Benjamin Franklin famously stated that the only two certainties in life are death and taxes. Had he been alive today, and part of a modern workplace, I’d bet he’d add a third to his list: death, taxes, and reporting.
Reporting Carries a Tax
Now, more than ever, organisations are accessing the vast quantities of data generated within their organisation to inform strategic and tactical decision making. The benefits of embracing data-centric decision-making are clear:
- Decisions can be taken using factual data, not relying solely only intuition or guesswork.
- Patterns, trends, and opportunities evident in the data can be capitalised on.
- Workflows can be optimised, leading to improved resource allocation.
- Inefficiencies can be identified and rectified, strengthening the bottom line.
Even so, there is still a tax to pay – many employees are spending more and more of their time analysing data and compiling reports, and less time on the business of production, marketing, or sales, the lifeblood of any company.
Whenever reports are being written:
- Salespeople are not selling.
- Marketers are not marketing.
- Production staff aren’t producing.
Often the very people employed to drive revenue growth in the company are removed from their core task, instead spending their time performing a function that many are not well suited to in the first place.
Despair not, there is a better way! Today I’d like to introduce you to our new Automation as a Service product offering.
Imagine having access to a fully automated reporting software suite that takes the pain out of reporting and provides you with the insights you need to take your business to the next level.
Before we dive into the nuts and bolts of what we have built, and how it can take your business to the next level, let’s take a quick look at how reports are typically compiled today.
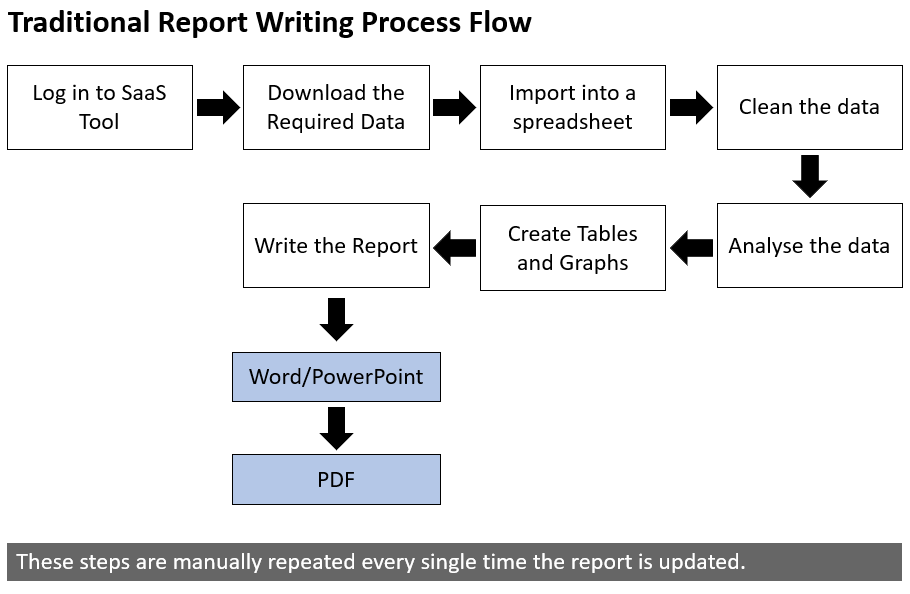
A Typical Data Gathering and Reporting Workflow
Producing a report generally comprises three distinct steps:
- Gathering the required data.
- Analysing the data and preparing the necessary visualisations.
- Compiling the report.
Let’s run through each of these steps now and how they are typically completed.
Gathering the Data
The raw data that forms the input into your report is typically retrieved by logging into the software package that houses the data and downloading everything you need as a spreadsheet or CSV file (if you’re downloading a pdf and manually inputting the data into a spreadsheet then please call us for help immediately!).
This is usually where the difficulties start to occur. If you’ve performed even a small number of data imports, you will have inevitably experienced some of these common stumbling blocks:
- The downloaded file doesn’t import or format correctly when brought into the spreadsheet. Date strings don’t correctly convert, currencies are missing symbols, regional settings on your PC create formatting nightmares.
- Incomplete data leads to gaps in your dataset, impacting the accuracy of your analysis and leading to errors in the resulting calculations.
- Large import files are automatically truncated leading to inadvertent data loss.
- The leading zero on imported data such as telephone numbers or postal codes get lost during the import process.
- The sheer size of the data import causes the spreadsheet to become unresponsive or unusable.
The truth is that as powerful as spreadsheet software is nowadays, things never work as well as they should the first time around. The data import phase is generally characterised by lots of rework, with the result that this phase inevitably takes longer than originally planned.
Analysing and Visualising the Data
Once the raw data has been successfully imported into your spreadsheet, it’s time to build the model, analyse the data, and generate the required figures and tables.
Depending on your propensity for detail and numbers, this is either time-consuming but relatively plain-sailing, or quickly develops into a full-blown nightmare.
There is often a lot of back and forth (usually with the one person in the office who “knows Excel”), before completing the analysis and generating the report graphs and tables.
Even after completing all this work the report is still not written!
Writing and Compiling
You’re on the home stretch – the data is in the format that you need, your tables and figures are ready to be placed into your report or presentation, and all that’s left to do is to create the report.
You’re not in the clear just yet:
- Is the document formatting correctly set up or are you starting from scratch each time?
- How do you add tables and figures into the report? Do you copy them directly from the spreadsheet (creating a live link between the two), or do you copy the figures as pictures and sever the link?
- What happens to linked graphs if the spreadsheet is moved, modified, or worse, deleted?
Of course, there is still the time-consuming job of actually writing the report and getting it distributed to everyone who needs a copy.
The True Cost
A lot of hard work has gone into producing the monthly sales report and it is finally ready to be presented. Unfortunately, it’s not good news: the sales targets have been missed again.
When asked for an explanation the sales staff have a simple answer:
“We spent too much time generating the report and not enough time on the road selling!”
There is a Better Way
I’d like to introduce you to a new service offering from Canard Analytics, that I’m calling Automation as a Service. Specifically, in this case, the automation of the difficult and time-consuming task of report writing.
The value proposition is simple:
- Detailed, high-quality reports delivered monthly (or at whatever cadence you require).
- Your staff freed up to focus on their core work responsibilities.
- No more delays or incorrect conclusions resulting from “spreadsheet errors”.
Software as a Service provides you with the tools that you need to do your job, Automation as a Service provides you with the data and insights to move your business forward.
Our Automated Reporting Toolbox
To build and deliver automated reports of an exceptionally high standard we have leveraged the power of Python, the de-facto standard language of data science, maths, and engineering.
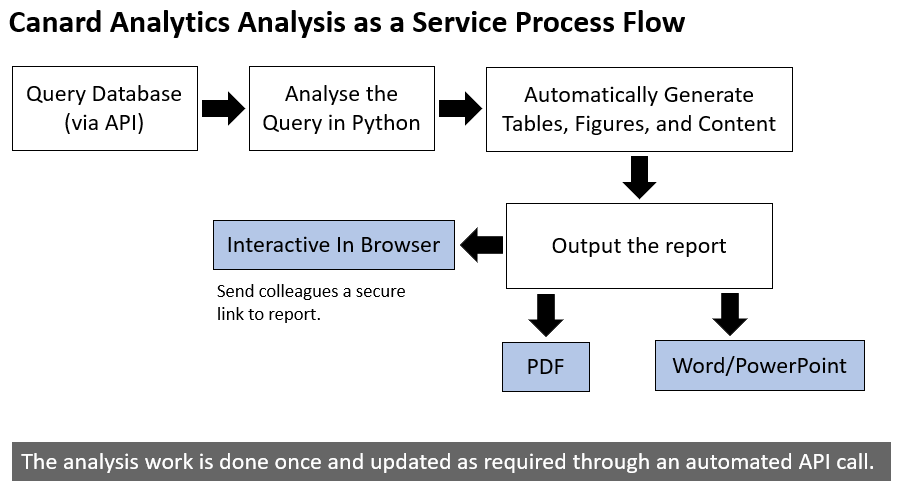
Our process flow is aimed at automating as much of the report generation as possible. There is some up-front work required up front to build the initial report, but once that is completed the subsequent reports are quickly and efficiently generated.
What Type of Reports Can We Automate?
Any report where the input data can be downloaded or exported from the source is a candidate for our automation software.
The ideal report is one where the input data can be accessed via a customer API. This allows us to go straight to the source to collect your data without needing to first download it into a raw data file.
An Application Programming Interface (API) is best thought of as a data bridge that connects two computers, allowing communication between the two, and a transfer of data across the bridge.
The client computer makes a request from the host for the required data. The host must then verify that the client has sufficient rights to access the data, and if successfully authenticated, delivers the data in a standardised format which can then be further analysed and processed.
This removes the need to manually log in to the software, download the raw data, and then import the resulting file into a spreadsheet.
Many software companies provide an API to their users. Here are a few of the more popular ones across a variety of industries and applications:
| Financial & Accounting | CRM Tools | Web | Productivity | E-commerce | Social |
|---|---|---|---|---|---|
| Quickbooks | Salesforce | Google Analytics | Slack | Stripe | |
| Xero | Hubspot | Moz | Teams | PayPal | X/Twitter |
| Freshbooks | Pipedrive | Semrush | Asana | Payfast | |
| Sage | Zoho | Ahrefs | Trello | ||
| Zoho | Zapier | Google Search Console | YouTube | ||
| Netsuite | Kissmetrics |
Most Software as a Service companies offer API access so if there is a particular package that you use that you don’t see listed just drop us an email and we’ll investigate further on your behalf.
What Can You Expect?
In short, high-quality reports with actionable insight, delivered to you at the frequency you require (weekly, monthly, quarterly etc).
We are in the process of building out an online analysis and reporting platform for our clients where you can log in to our website and receive your ordered reports every week/month/quarter.
By building a client platform we are making it exceptionally easy for you to access your reports, to communicate with us, and to request additional work as required.
Our reports are available in a number of different formats to ensure that you get exactly what you need.
- An interactive browser-based report that can be viewed on any device from a mobile phone to a 4K monitor.
- A PDF and Microsoft Word/PowerPoint version of the report correctly formatted for printing.
- Every image in the report exported as an image file for you to use.
- The raw data from every table created in a CSV file output.
You can expect us to work with you to produce a report to your exact specifications.
You can expect new insights and a more thorough analysis than you’re currently receiving.
You can expect on-time delivery of a high-quality report.
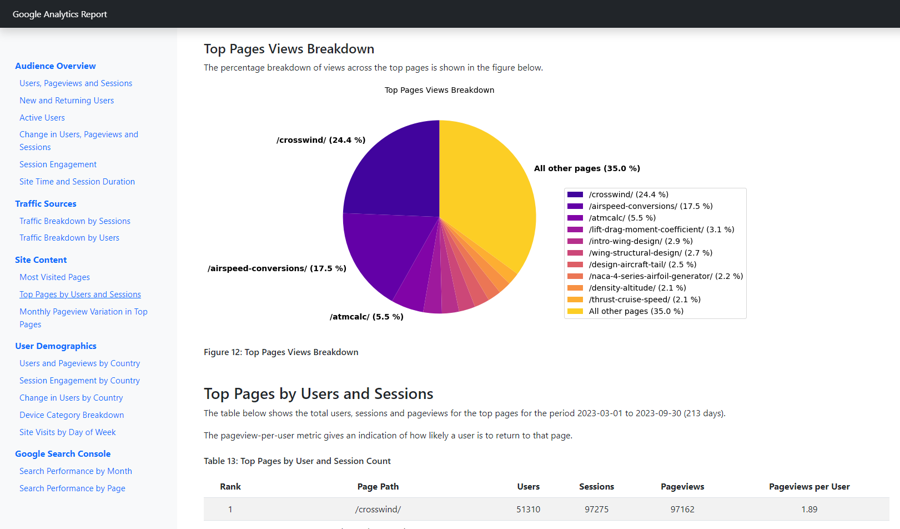
Here is a sample report produced for a niche content website using the Google Analytics 4 API. This is just one example of the type of report that we can build for you.
Why Us?
I founded the Canard Analytics after a decade spent working as an aeronautical engineer in the demanding field of aircraft structural analysis. This is an industry with no margin for error as even small mistakes or oversights can quickly result in a catastrophic failure of an aircraft in flight.
It is unsurprising then that the aerospace industry takes reporting incredibly seriously.
The sheer volume of analysis and reporting work required to certify a new aircraft necessitates that automation play a central role in the process.
Before starting Canard Analytics, I spend time working at an aircraft startup where I developed composite structural analysis tools in Python with a very basic automatic reporting output. This was where I first saw the potential for a fully automated reporting system, and realised the enormous productivity gains that could made with such a platform.
I left that company to pursue my vision of a high-quality, universal reporting tool built in Python that could be applied to any analysis task. That vision has now been realised and is available to you today.
Why Now?
“Without data, you’re just another person with an opinion” – W. Edwards Deming
In our data-driven world, making strategic decisions without the data to back them up is akin to driving down a dark road with nothing more than a candle to light your way. Our increasingly competitive World necessitates that every opportunity to gain an advantage be pursued.
There is a rich vein of data flowing through your organisation that is just waiting to be tapped. Can you really afford let it continue to flow by?